Case Study: Using GO Annotations to Interpret Immunology Data
Despite the lack of manually verified GO annotation to immune system process terms, some immunological researchers have been using GO annotation to interpret their datasets. The following case study illustrates the strengths and current weaknesses of the GO and provides a model for immunologists and other biologists wishing to utilise the growing field of bioinformatics for microarray data mining, hypothesis generation and testing.
Paper Details
The paper cited in this case study is:
.
Components of the antigen processing and presentation pathway revealed by gene expression microarray analysis following B cell antigen receptor (BCR) stimulation.
BMC Bioinformatics. 2006;7:237. [PMID:16670020 | doi:10.1186/1471-2105-7-237]
The paper uses the CLASSIFI algorithm; for more information, please see the CLASSIFI website.
Analysis
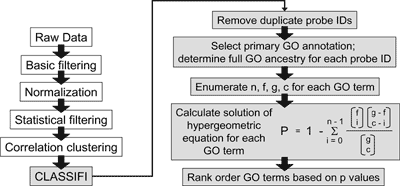
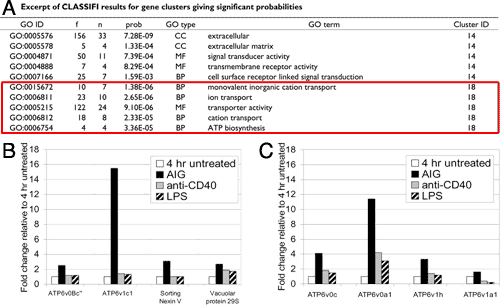
Lee et al. (2006) describe how the hierarchical nature of the GO can assist in the interpretation of experimental data. A group of genes whose expression is increased specifically in response to signaling through the antigen receptor in B lymphocytes was identified through a series of gene expression experiments. The CLASSIFI algorithm (figure 1) was used to determine that a subset of genes in this gene cluster appeared to represent an underlying biological process, transport, which was responding to antigenic stimulation in these cells (figure 2A). Follow-up experimentation confirmed that antigen receptor stimulation uniquely stimulated vesicle and ion transport in B cells (figure 2B, 2C). However, it is important to note that few genes in this group actually carried the same GO annotation terms. This reflects the different levels of knowledge and annotation available for individual genes. For example the Atp6v0b protein is annotated based on its known involvement in ATP hydrolysis-coupled transport, whereas less is known about the Spcs3 protein other than its involvement in transport processes in general . By capturing the hierarchical relationships in the GO, the CLASSIFI algorithm is able to look for significant associations at all levels of annotation granularity, and in this case identified transport as the process that these genes have in common. Annotations based on flat vocabularies would not have supported this kind of inference.

Figure 1: Work flow for using CLASSIFI to process B cell microarray data (larger version).

Figure 2: Using GO annotation with CLASSIFI to analyse B cell microarray data (larger version). A. Gene cluster 18 chosen because of GO terms attached; B. RT-PCR confirms AIG-ligand specificity for genes in cluster 18; C. RT-PCR confirms AIG-ligand specificity for genes with same GO annotation not in probe set.
Figures 1 and 2 reproduced with permission from the original paper, PMID:16670020.
Limitations
One of the limitations of this study is that the analysis of this dataset using CLASSIFI was constrained to more general biological processes due to the lack of gene annotation with a well-defined hierarchy of biological processes from the immunology domain. The authors tried, with partial success, to overcome this problem by manually curating 38 genes in the cluster. Funding of manual GO curation would enable dedicated GO immunology curators to utilise the new extended immunology-related GO domain, which provides a richer representation of immunological processes, in the annotation of high priority genes of interest to immunologists. A repeat analysis of the Lee et al. dataset using these additional annotations could potentially reveal new immunology-specific processes that are responding to antigen receptor stimulation.
Further examples
To find more examples try searching GOPubMed for 'gene ontology AND immune'.